October 30, 2025
Amplitude Anomaly Detection: Alerts, Cohort Breakdowns & Driver Analysis


If you use Amplitude to track user behavior, funnels, and retention, you know it's powerful tool, but it only shows you what's happening when you look. Changes can occur between manual reviews, such as a sudden drop in activation, a spike in feature usage within a specific group, or a retention issue in a recent cohort that may go unnoticed until the next check-in.
Gap in Analytics Stack
Amplitude is great for investigating questions — if you know what to ask in advance. But product teams track hundreds of metrics, and manually monitoring across cohorts, devices, or countries is not scalable. What often goes unseen:
Lower retention in a specific user cohort
iOS feature usage is dropping while Android stays steady
Higher onboarding drop-offs for European users
Weekend funnel conversion dips
These insights are hidden within your Amplitude data until someone finds them manually.
How Automated Amplitude Monitoring Helps
Automated anomaly detection acts as a continuous AI analyst. It monitors your data and identifies relevant changes as they occur.
1. Detection Across Cohorts
Amplitude provides insights into user segments, but daily manual review of each cohort’s performance is not feasible. With automated monitoring, you can track retention, engagement, and conversion rates for all your cohorts simultaneously. If one cohort starts acting differently, such as new users, premium subscribers or users from a certain source, you'll know.
Use case: A fitness app’s Week-42 cohort shows 25% lower retention. Instead of noticing it a week later in a dashboard, the team gets a Slack alert within a day and fixes a notification bug before it impacts thousands.
2. Automated Driver Analysis
This is where monitoring Amplitude can make a big difference. When an anomaly is found, the system automatically analyzes which factors cause the change, such as platform, location, app version, user properties, or other attributes you track in Amplitude.
Use case: An e-learning platform launches a new lesson recommendation algorithm. Two days later, DataLight flags an anomaly:
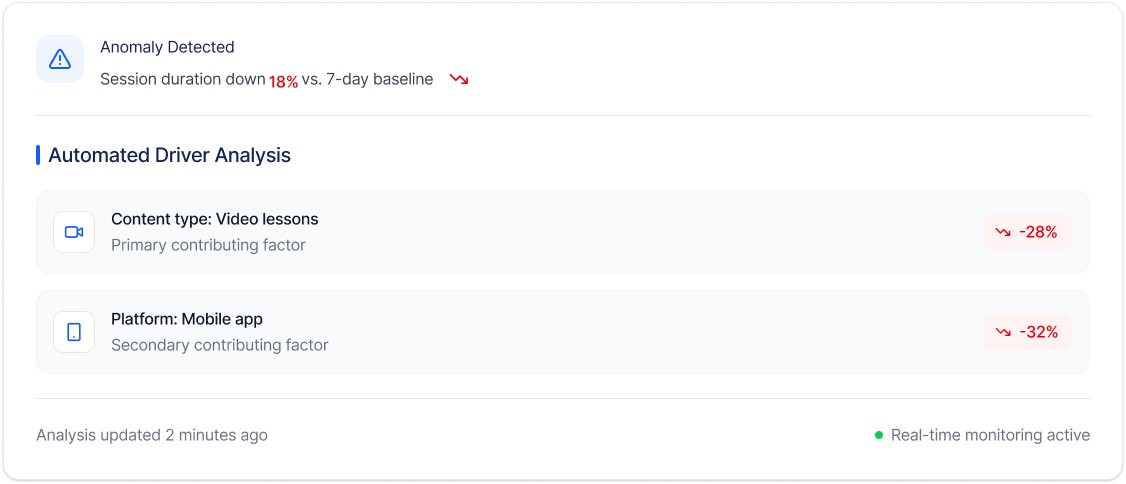
Within minutes, the team identified issue: new recommendation algorithm presents more video content to mobile users, while many casual learners prefer text-based lessons on mobile, particularly during commutes. This shift leads to decreased engagement among these users.
3. Cross-Metric Correlations
Your Amplitude metrics are connected. For example, a drop in activation often relates to changes in onboarding completion. A spike in feature usage might happen alongside changes in user retention or engagement.
Automated monitoring connects related signals. When multiple related metrics change simultaneously, you receive detailed alerts that provide a comprehensive view of the situation.
Use Case: A media streaming app receives an alert:
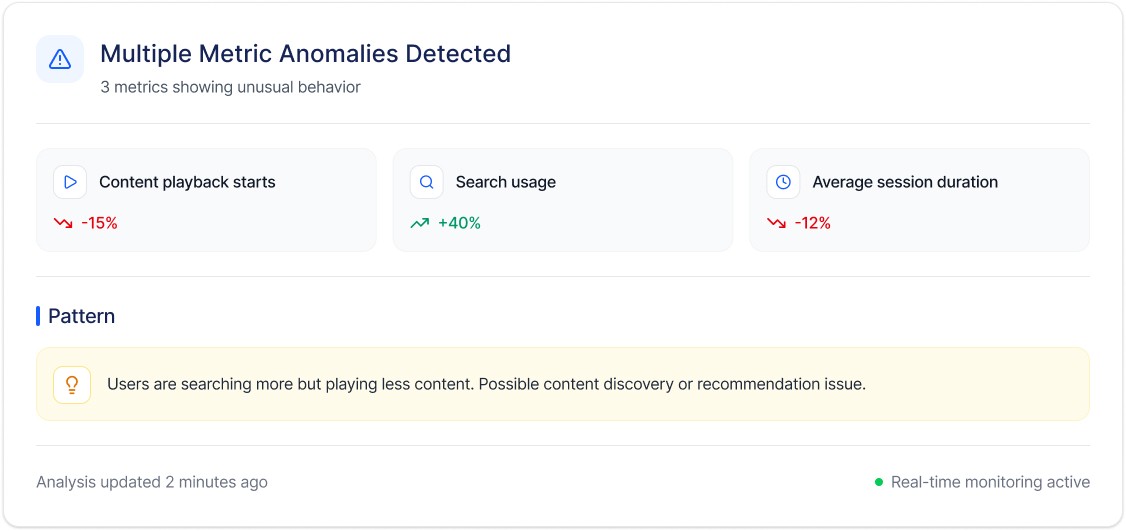
4. Find Opportunities, Not Just Problems
AI monitoring also highlights positive anomalies—like faster feature adoption or high retention in specific regions to help you double down on what works.
Case Study
B2C mobile app company with 500K monthly active users was using Amplitude to track user journeys, but relied on weekly dashboard reviews to spot issues.
Before | After |
|---|---|
|
|
|
|
|
|
Security & Integration
Read-only connection to Amplitude, no data modification
API credentials are encrypted and securely stored
You maintain full control and can revoke access anytime from the Amplitude settings
DataLight monitors events, funnels, and drop-offs; cohort behavior & conversions; custom properties and segments.
Turn Amplitude from Reactive to Proactive
Investing in Amplitude demonstrates your commitment to data-driven product decisions. Your Amplitude data contains numerous insights to drive product improvement, user retention, and new opportunities. But only if you catch them in time.
Start DataLight 7-day free trial to never miss critical changes again.


